WIP Run Chart Report
How many tasks are in progress at the same time by day and how their average age changes. The report is available on the paid plan.
Premium. The WIP Run Chart report is available on the paid plan.
Overview
The WIP Run Chart shows how many tasks are in progress at the same time (Work In Progress, WIP) by day, and how their average age changes. The report helps you see team overload and growing "traffic jams": when there are more and more tasks in progress and they are getting older, it is a signal that work is piling up and not being completed.
Chart Structure
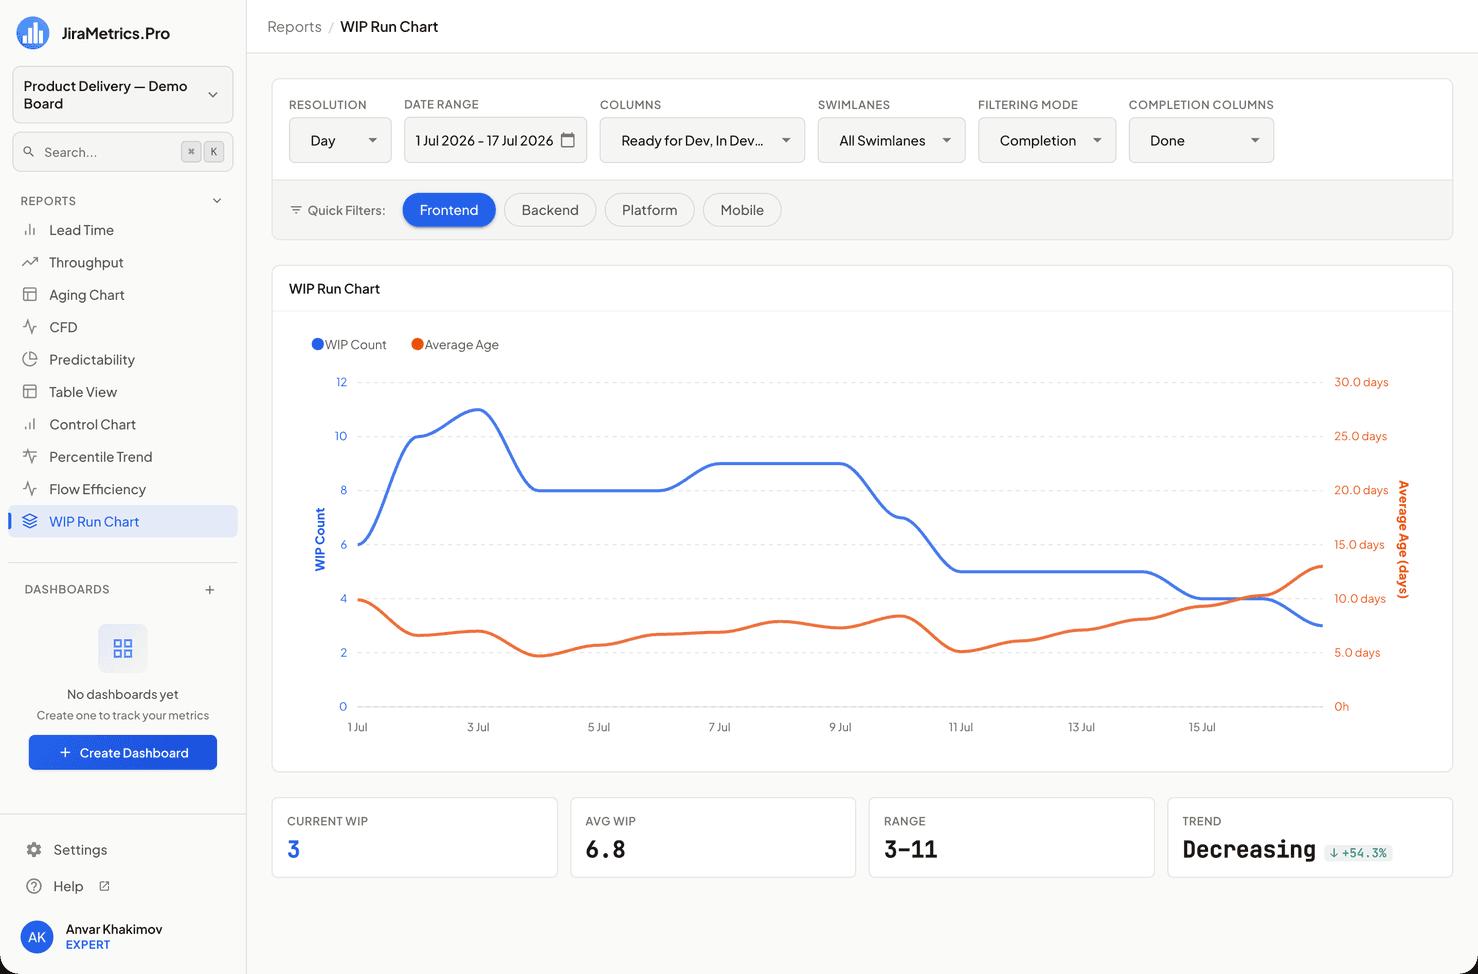
A chart with two Y-axes:
- X-axis: Days.
- Left Y-axis: The number of tasks in progress (WIP) — the blue line.
- Right Y-axis: The average age of tasks in progress in days — the orange line.
How It Is Calculated
- For each day, a task is considered in progress if on that day it was in one of the selected columns.
- WIP for a day = the number of such tasks.
- Average age = the average across tasks of the accumulated time they have spent in the selected columns by that day.
Metrics of This Report
Below the chart there is a metrics block:
- Current WIP — the WIP on the last day of the range. Highlighted.
- Avg WIP — the average WIP value across all days.
- Range — the minimum and maximum daily WIP over the range.
- Trend — the direction of WIP dynamics. The average WIP over the last quarter of the range is compared with the first quarter (at least 4 days of data are required): a change of more than 5% in either direction →
Increasing/Decreasing, otherwiseStable. A decrease in WIP is an improvement (green ↓), an increase is a deterioration (red ↑).
This is a trend "within the selected range", not a comparison with a separate previous period. For more details, see the Metrics and Trends section.
Interactive Elements
When hovering over a day, a tooltip appears:
- Date
- WIP Count — the number of tasks in progress on that day
- Average Age — the average age of tasks (hours if less than a day, otherwise days)
Impact of Settings
- Selected columns determine which columns are considered "in progress".
- Date range sets the grid of days.
- The report has no settings of its own. There is no WIP limit line in this report — it exists on the corresponding dashboard widget.
Special Cases
- If there is no data, the report shows an empty state.
- If a task was not yet on the board on a particular day, it is not counted on that day.
Usage Recommendations
- Keep WIP limited — the fewer tasks in progress at the same time, the faster they are completed.
- Growing WIP together with growing age is an alarming signal: tasks are piling up and aging, the flow is slowing down.
- Compare WIP with throughput (the Throughput report): if more work is taken on than can be completed, WIP will grow.
Last updated on
Flow Efficiency Report
What share of a task's completion time is active work and what share is waiting. The report is available on the paid plan.
Task Flow
How to open and read the Task Flow dialog in JiraMetrics.Pro — a breakdown of a task's journey across board columns, finding the causes of long lead times, and preparing material for retrospectives.