Tasks Table Report
Detailed description of the Tasks Table report in JiraMetrics.Pro, its functionality and interpretation.
Overview
The Tasks Table provides a detailed tabular view of your project's tasks. This report allows you to analyze tasks that fall under selected filters, with the ability to sort and view the timeline of each task.
Main Features
Task Filtering
The same filters used in other reports are used to customize the task selection. You can learn more about working with filters in the Data Sampling and Filtering section.
Time Display Format Configuration
You can choose a convenient time display format:
- Default — a compact view like "10d 8h" (the default format)
- Hours — hours
- Days — days
- Weeks — weeks
- Timestamp — the number of milliseconds
Examples of display for a task that took 10 days and 8 hours:
- Default: "10d 8h"
- Hours: "248.0h"
- Days: "10.3d"
- Weeks: "1.5w"
- Timestamp: "892800000" (milliseconds)
Changing the time format dynamically updates the data in the table.
Data Export
The "Download CSV" button allows you to export all filtered tasks to a CSV file for further analysis.
It's important to note that in the CSV file, the numeric time formats ("hours", "days", and "weeks") are output as numerical values without units of measurement, rounded to one decimal place. For example:
- 248 (for hours)
- 10.3 (for days)
- 1.5 (for weeks)
The "Timestamp" format in CSV is preserved in the same form as in the table — in milliseconds.
Sorting
Sorting is possible by any table column, including task ID, total lead time, and time in each column.
Table Structure
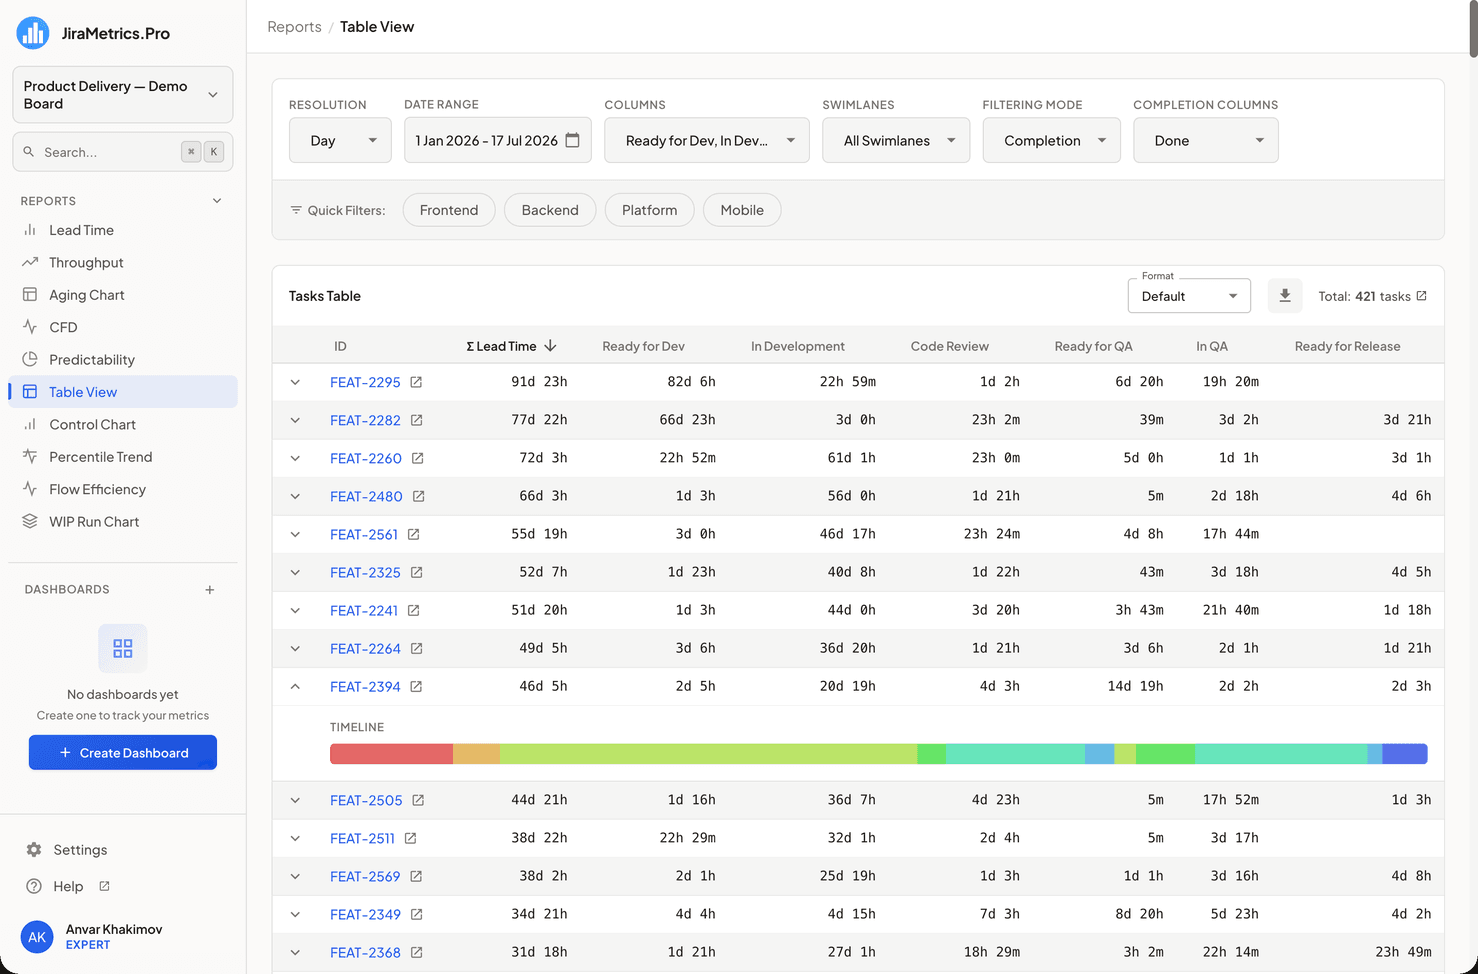
Table Header
- ID: Task identifier. Clicking it opens the Task Flow dialog. Next to it is a separate arrow icon — it opens the task in Jira in a new tab.
- Σ Lead Time: Total task completion time (summed across the selected process columns).
- Process columns: Time spent by the task in each selected workflow column.
Task Rows
Each row represents an individual task and contains:
- Option to expand to view a detailed timeline.
- Task ID (clicking opens the history) and a separate icon for going to Jira.
- Total task completion time.
- Time spent in each selected process column.
Detailed Task View
When expanding a task row, the following is displayed:
Timeline
- Visual representation of the task's lifecycle.
- Each segment represents time spent in a specific column.
- Color coding of segments corresponds to different process stages.
Interactive Elements
- Hovering over a timeline segment displays a tooltip with the column name and exact time spent in it.
Data Interpretation
- Total lead time: Allows you to assess the overall duration of task completion.
- Time in columns: Helps identify stages where tasks are delayed the longest.
- Timeline: Provides a visual representation of the task's passage through various process stages.
Practical Application
- Process efficiency analysis: Use sorting by total lead time to identify the longest tasks.
- Bottleneck identification: Analyze time in individual columns to determine stages requiring optimization.
- Task comparison: Use timelines to compare lifecycles of different tasks.
- Reporting: Export data to CSV for creating detailed reports and presentations.
Conclusion
The Tasks Table provides a detailed view of each task in your workflow. With this report, you can analyze the efficiency of your development process, identify problem areas, and make informed decisions to optimize workflow.
Last updated on