Installation
Instructions for installing JiraMetrics.Pro (JMP) in your browser.
System Requirements
- Chromium-based browser (Chrome, Edge, Yandex, Opera, etc.)
- Access to Jira
Installation Process
-
Go to the Chrome Web Store.
-
On the extension page, click the "Install" button.
-
Confirm the installation if your browser asks for permission.
-
After the installation is complete, you'll see the JMP icon in your browser's extension panel.
Verifying the Installation
Open Jira and go to any task board.
On Jira Server and Data Center, two buttons appear on the board page:
- An Analyze Metrics button in the top right corner of the board.
- An Analyze Metrics item in the left sidebar menu, next to Reports.
If you can see these buttons, JMP is successfully installed and ready to use.
If you use Jira Cloud
The button doesn't appear on every board — this is normal and does not affect your work. While on a board, click the JMP icon in the Chrome extension panel and the dashboard opens automatically. From then on, you can open any board the same way.
Right after installation, clicking the icon opens a window with a short guide:
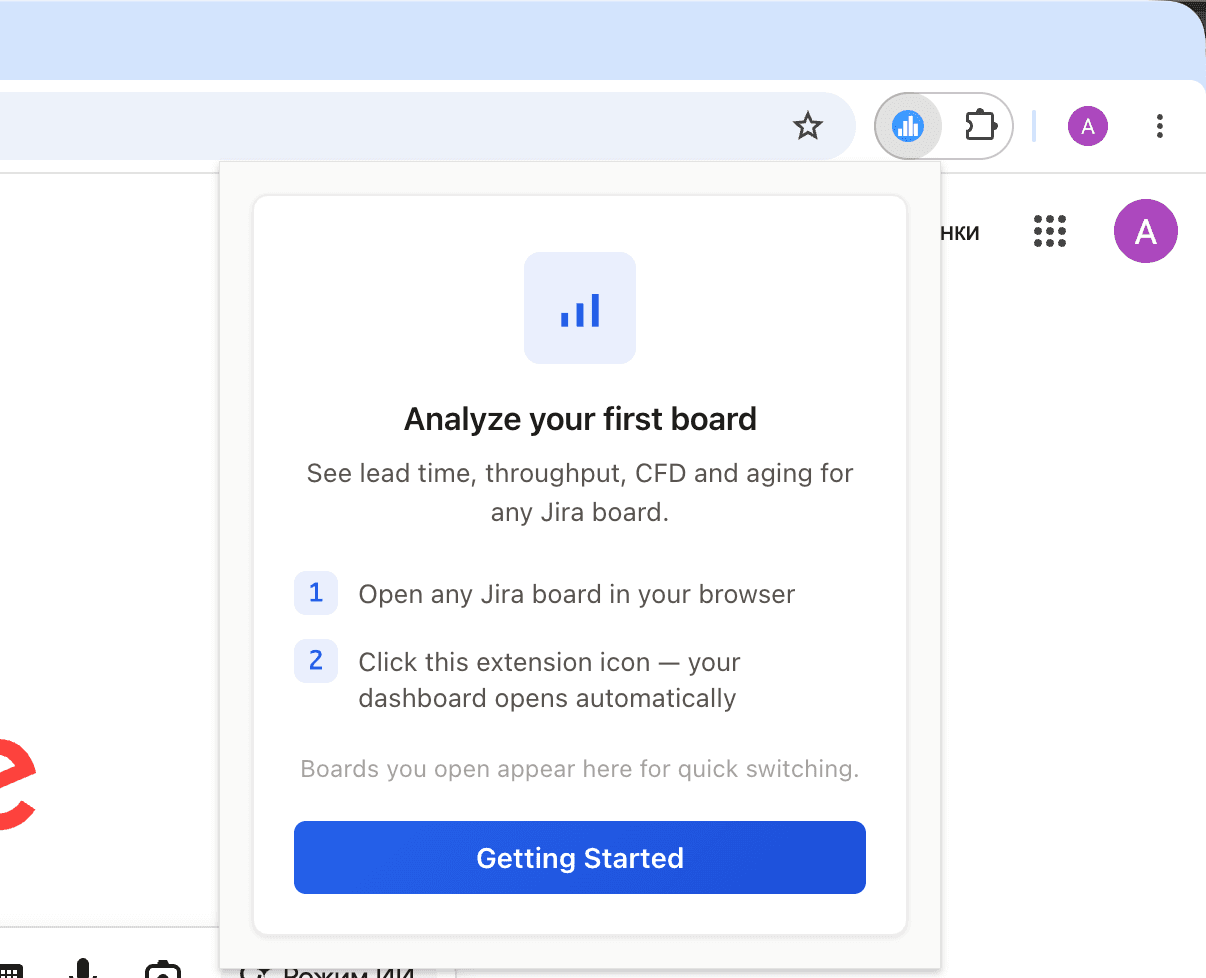
The boards you have opened are remembered and appear in this window — you can quickly switch between them.
Troubleshooting
If the JMP buttons don't appear on a Jira Server or Data Center board:
- Make sure the extension is enabled in your browser settings.
- Try refreshing the Jira page.
- If the problem persists, try disabling and re-enabling the extension.
If you experience any other installation issues, please contact us at support@jirametrics.pro.
Last updated on