Predictability Chart Report
Detailed description of the Predictability Chart report in JiraMetrics.Pro, its construction and interpretation.
Overview
The Predictability Chart is a metric proposed by Kanban University to measure the stability and predictability of a team's workflow. This report helps assess how reliably a team can forecast task completion times.
Building the Predictability Chart
1. Data Collection
- Collect lead time data for each task over a specific period.
- It's important to ensure data accuracy and cover a sufficient time range for statistical significance.
2. Percentile Calculation
- 50th percentile (median): The time value below which 50% of tasks are completed.
- 98th percentile: The time value below which 98% of tasks are completed.
3. Calculating the 98% / 50% Ratio
- Ratio = 98th percentile / 50th percentile
- This ratio shows the degree of variability in the process. A lower value means a more predictable process.
4. Plotting the Graph
- X-axis: Calendar months. The graph is always plotted by months, regardless of the Resolution setting.
- Y-axis: The 98% / 50% ratio for each month (the axis label is "Ratio to median (98% / 50%)")
- Points on the graph are connected with a line; a separate dashed line shows the overall trend. The trend line is only plotted when there are three months of data or more — a trend cannot be determined from one or two points
Chart Structure
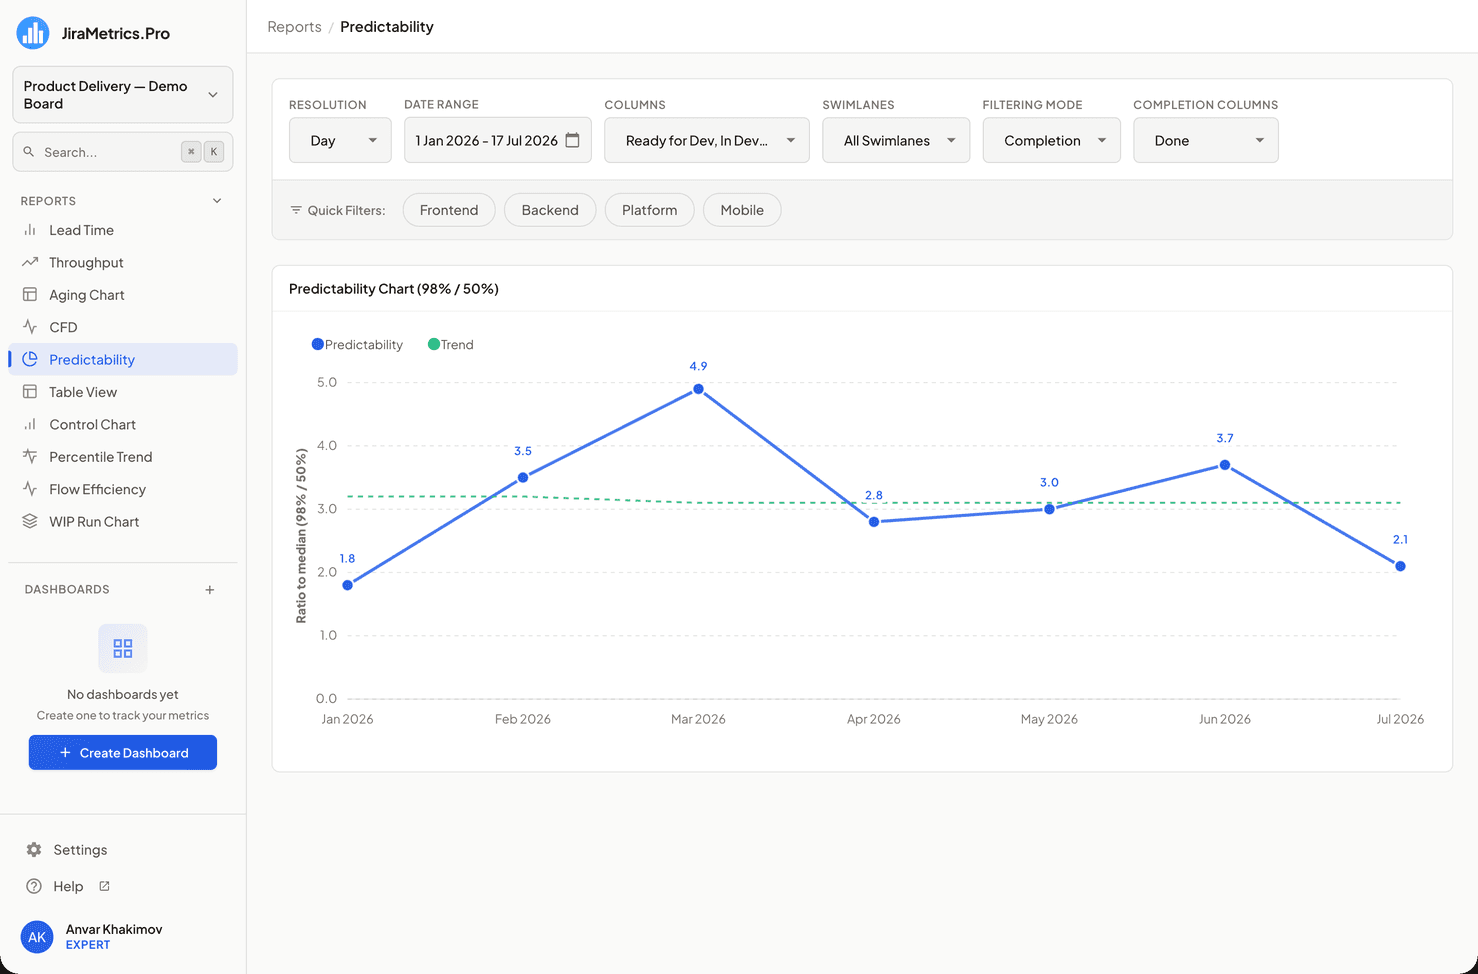
The chart shows a line representing the change in the 98% / 50% ratio over time. The values on the graph reflect the degree of process predictability.
Interpreting Values
The main principle: the lower the ratio, the more predictable the process.
- Value close to 1: very high predictability — the "tail" of long tasks barely differs from the median.
- The higher the value — the greater the spread: some tasks take much longer than typical ones, and the process is less predictable.
Reference points for interpretation:
- up to 3 — predictable flow: the "tail" of long tasks is close to typical tasks;
- from 3 to 5.6 — moderate variability;
- above 5.6 — a fat tail. The 5.6 reference point is not arbitrary: it is the P98/P50 ratio of a "whatever happens" process (pure randomness with no flow management). Higher values mean the tail is heavier than random — the process requires attention.
On the graph this corresponds to the dashed Fat-tail threshold (5.6) line. And most importantly: focus primarily on the dynamics (whether the ratio is decreasing or growing), not on a single absolute value.
Trend Analysis
- Decreasing ratio over time: Indicates process improvement and increased stability.
- Increasing ratio: May signal possible problems or changes in the process that require attention.
- Stable line: Indicates an unchanged, but not improving process.
Report Configuration
All filters (period, swimlanes, columns, filtering mode, completion columns, Resolution) are located in the common filter panel above the report. For more details, see the Data Sampling and Filtering and Filtering Modes sections.
The report always calculates completion time in days — the Resolution setting does not affect it. The graph is always broken down by calendar months.
Practical Usage Tips
-
Regular monitoring: Update and analyze the chart regularly to detect deviations in a timely manner.
-
Finding causes of variability: For high ratios, analyze tasks with long completion times to identify causes of delays.
-
Implementing improvements: Use the data obtained to optimize processes, eliminate bottlenecks, and increase efficiency.
-
Comprehensive analysis: Consider the Predictability Chart in combination with other metrics, such as Lead Time and Throughput, for a full analysis.
-
Context consideration: Take into account the specifics of the project and team when interpreting values.
Metric Limitations
- Does not account for task size or complexity.
- May be sensitive to outliers, especially with a small number of tasks.
- Does not reflect the reasons for changes in predictability.
Conclusion
The Predictability Chart is a valuable tool for assessing the stability and predictability of the development process. Regular analysis of this metric will help you identify areas for improvement, optimize work processes, and increase team efficiency.
Last updated on